Civil Tools
 Toolbar : Civil Tools
Menu : GeoTools -> Civil Tools -> Surfaces-> Create TIN (Delauney triangulation) & Voronoi polygons  CmdLine : GT_TRIANGULATE
The GT_TRIANGULATE command connects a set of points to form irregular triangles based on the TIN model. The GT_TRIANGULATE command also provides an option to create Voronoi polygons.
In mathematics, a Voronoi diagram is a partitioning of a plane into regions based on distance to points in a specific subset of the plane. It is also called a Voronoi tessellation, a Voronoi decomposition, a Voronoi partition, or a Dirichlet tessellation. Voronoi diagrams have practical and theoretical applications to a large number of fields, mainly in science and technology.
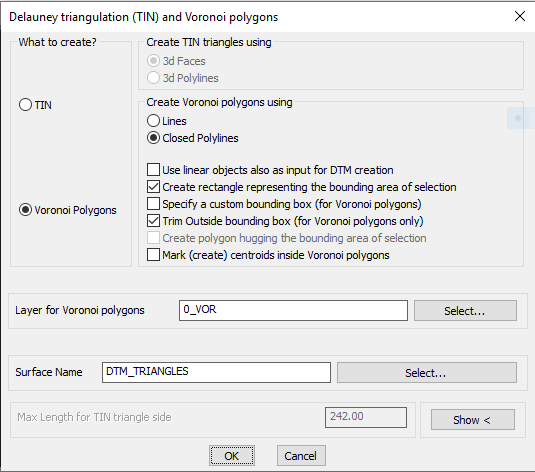
The GT_TRIANGULATE command creates the surface as closed 3d polylines or 3dfaces. These are created in the layer Surface_<Surface_Name>.and the surface data is also stored externally in a GeoDTM file. The GeoDTM file is saved in the User/AppData/....GeoTools folder
For example, on my computer, this would be at "c:\Users\RAKESH RAO\AppData\Local\GeoTools\BricsCAD\V20\DTM_Surfaces" .
There are options in this command to create a bounding box (which is created as a closed polyline in the Surface_<SurfaceName>_BOUNDARY layer) and also an option to create a boundary hugging closed polyline across the entire surface data. Please be aware that this can be a time-consuming operation depending on your data-set.
You can also specify a value for the maximum length for the sides of the TIN triangle. Setting this to a realistic value will help you to avoid creating triangulation outide the intended boundaries of the data-set. You must set this value based on the average expected correctly compute side of each TIN triangle.
Watch: ![]()
Toolbar : Civil Tools 
Menu : GeoTools -> Civil Tools -> Surfaces -> Import a TIN Surface (GeoTDTM) CmdLine : GT_IMPORTSURFACE
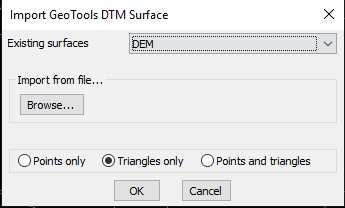
The GT_IMPORTSURFACE command is used to import a previously saved GeoDTM TIN data.
GeoTools TIN data is saved in external .GeoDTM files using the GT_EXPORTSURFACE command and the same can be retrieved here.
 .
.
By default, the .GeoDTM files are saved in the <user/AppData/Local...GeoTools> folder, and their list is shown in the drop-down menu. You can also import the Surface from a .GeoDTM file stored elsewhere on your computer. Use the Browse button to select such a file.
While importing, you can specify whether you want to import the points, TIN triangles or bot. At the end, it reports the number of points or triangles imported.
The rectangular boundary of the surface also is imported as a closed 2d polyline.
Toolbar : Civil Tools 
Menu : GeoTools -> Civil Tools -> Surfaces -> Export a TIN Surface (GeoTDTM) CmdLine : GT_EXPORTSURFACE
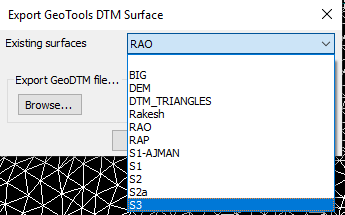
The GT_EXPORTSURFACE command is used to export a selection of 3d polylines or 3dfaces into .GeoDTM TIN data files, stored externally.
By default, the .GeoDTM files are saved in the <user/AppData/Local...GeoTools> folder.
GeoTools TIN data is saved in external .GeoDTM files using the GT_EXPORTSURFACE command and the same can be retrieved here.
 .
.
By default, the .GeoDTM files are saved in the <user/AppData/Local...GeoTools> folder.
A 'Browse' button is also provided to enable you to save the surface in a different location. In such case, two copies of the surface is saved, one in the default AppData folder and another in user-specified location.
Toolbar : Civil Tools ![]()
Menu : GeoTools -> Civil Tools -> Surfaces -> Change the elevation of a surface CmdLine : GT_ELEVATESURFACE
Description Pending
Toolbar : Civil Tools ![]()
Menu : GeoTools -> Civil Tools -> Surfaces -> Copy a TIN surface CmdLine : GT_CopySurface
Description Pending
Toolbar : Civil Tools ![]()
Menu : GeoTools -> Civil Tools -> Surfaces -> Delete a TIN Surface CmdLine : GT_DeleteSurface
Description Pending
Toolbar : Civil Tools 
Menu : GeoTools -> Civil Tools -> Surfaces -> (Cut/Fill) Volume between surfaces CmdLine : GT_SURFACEVOLUME
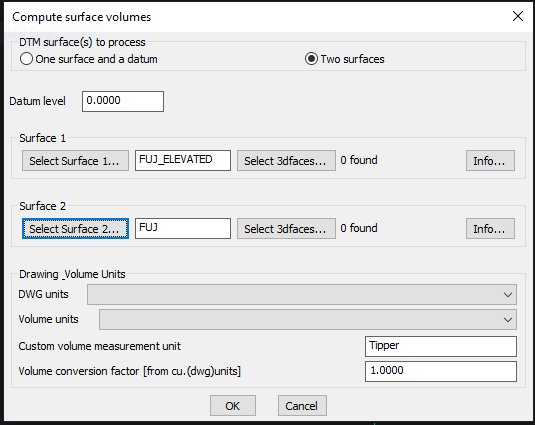
The GT_SURFACEVOLUME command is used find the volume between two surfaces, or between one surface and one datum reference elevation.
You must specify the surfaces from the list. They must be saved surfaces and must be imported into the drawing as well.
The command computes the volume of the surfaces and reports them in drawing units. This is a work-in-progress command and in the next update, it is planned to have the ability to present the volumes in different units.
For example, you can specify the drawing unit and the volume unit and the system will do an automatic conversion and present the volume quantities accordingly.
Toolbar : Civil Tools
Menu : GeoTools -> Civil Tools -> Surfaces -> Create Boundary Around Surfaces/ Points CmdLine : GT_DrapeBoundary
Description Pending
Toolbar : Civil Tools
Menu : GeoTools -> Civil Tools -> Surfaces -> Create Grading Object CmdLine : GT_CreateGrading
Description Pending
Toolbar : Civil Tools 
Menu : GeoTools -> Civil Tools -> Map Sheet Tools -> Create and place map sheet index block CmdLine : GT_SHEETINS
The GT_SHEETINS command allows to insert a sheet-index (a block which is rectangular in shape and shows the boundary of a plotted sheet) on a map by specifying the required size of sheet in X (horizontal) and Y (Vertical) direction with specified rotation angle. The block carries a single attribute which also stores the sheet name.
Watch: ![]()
Toolbar : Civil Tools 
Menu : GeoTools -> Civil Tools -> Map Sheets -> Create Map Sheets from (around) Center-Lines CmdLine : GT_MAPSHEETMAKER
The GT_MAPSHEETMAKER command is used to create a corridor around a selected center-line (multiple selection is possible) and wblock all the objects inside that corridor into a new DWG.
The command will ask for the offset distance (sideways) and distance in front-back direction, and will offset and extend the lines and join them to create a closed polygon.
Next, all crossing objects falling inside this polygon are selected and wblocked into a drawing which has a running name, like _Sheet_1, 2, 3 and so on.
It was decided not to do the trimming and offsetting in one single command because of complications and performance issues. Once the sub-drawing is created using this command, you can open it and use the next command GT_MAPSHEETTRIMMER for automatic external trimming.
Watch: ![]()
Toolbar : Civil Tools ![]()
Menu : GeoTools -> Civil Tools -> Map Sheet Tools -> Create layouts from map sheets CmdLine : GT_MAPSHEETLAYOUTS
Description pending
Toolbar : Civil Tools ![]()
Menu : GeoTools -> Civil Tools -> Map Sheet Tools -> Place map sheets along a linear geometry CmdLine : GT_MAPSHEETPLACE
Description pending
Toolbar : Civil Tools ![]()
Menu : GeoTools -> Civil Tools -> Map Sheet Tools -> Zoom to Map Sheet CmdLine : GT_MAPSHEETZOOM
Description pending
Toolbar : Civil Tools 
Menu : GeoTools -> Civil Tools -> Map Sheets -> (Auto)Trim outside map sheet CmdLine : GT_MAPSHEETTRIMMER
The GT_MAPSHEETTRIMMER command trims everything that lies outside a closed polygon. It is designed to be used by GeoTools users who need to routinely trim outside a map sheet.
This is the equivalent of the EXTRIM command of AutoCAD. Please note that this command can only trim 2d lines, polylines, circles & arcs but not hatch patterns, blocks, text etc.
These must be manually edited. The above two commands can be used to automate your process of creating the smaller drawings and trimming the boundary. It cannot be 100% automatic but with these two commands, you can achieve upto 80-85% automation.
Watch: ![]()
Toolbar : Civil Tools ![]()
Menu : GeoTools -> Civil Tools -> Create contours from TIN model CmdLine : GT_CONTOURBUILDER
Description pending
Toolbar : Civil Tools 
Menu :GeoTools -> Build -> Interpolate point elevation from neighboring polylines - manual pick CmdLine : GT_PTINTERAUTOMATIC
The GT_PTINTERAUTOMATIC command is useful to assign point elevations by interpolating the elevations of neighboring polylines or 3dfaces from surface data. This is done by automatically scanning the surface data layers.
You are first asked for an initial zoom window size. If surface data for interpolation could not be found in the specified zoom, the value is incremented by 1.0 unit and a new search is initiated.
Next, you must specify the surface name to be used. A list of available saved surfaces are presented. The surface data must also be available in the drawing in the layer Surface_<Surface_Name>. If such data is not available, it must first be imported using the GT_IMPORTSURFACE command.
You can get the surface elevation at the picked point or select a number of existing points (or blocks) and have their elevations updated by interpolation.
Toolbar : Civil Tools ![]()
Menu : GeoTools -> Civil -> Create a DEM grid from surface data CmdLine : GT_DEMGRID
Description pending
Toolbar : Civil Tools 
Menu : GeoTools -> Civil Tools -> Annotate chainages along a route CmdLine : GT_CHAINAGE
The GT_CHAINAGE command is used to annotate chainage distances along a traverse. The traverse must be drawn as a 3d or 2d polyline.
The annotation is done using a default tick block (named TICK-n) or a user-defined block. The What to annotate section determines the points along the traverse where the annotation is done. You can create annotations in several ways - either at each vertex of the polyline (Source) or at a fixed regular distance (Interpolate) along polyline, both Source and Interpolate or at picked points locations along the traverse. Please be aware that picked points annotation are always slope measurements and not horizontally projected ones irrespective of the settings shown in Measure Distances in.
Annotation can be done using chainage value or route name. Depending on the selection, the tick mark block will display the route name or the chainage value as its attribute.
Note: The Chainage output can be saved as Comma Separated Value (CSV) file, which becomes easy to open in Excel and do the required editing
Gap Length: This is the distance between the end of the annotation tick mark and the annotation text.
Starting Chainage Count: When the Annotate Using is set as Route Name, the Starting Chainage Count defines the running number count of the first chainage point.
Chainage Format: This drop down box allows to select either 0+00, 0+000 or 0+0000.
If 0+00 is selected, the distance of 100 drawing units is written as 1+00 and 1000 feet is written as 10+00..
If 0+000 is selected, the distance of 1000 drawing units is written as 1+000 and 100 feet will be 0+100.
Choose the format that most closely suits your annotation style.
Chainage Description Options:
You can import and display additional chainage descriptions (at specified changes) from an external ASCII file. This file must be a comma delimited ASCII text file in the following format:
<chainage> , <description>
0.0,BEGIN RECONSTRUCTION
26.7,INTERSECTION
138.5,EXIST LANDING
187.0,FILL EXISTING SWALE
246.75,T/S 14"PINE LT
278.5,EXIST WB,INSTALL DIP
299.0,BEGIN AB@4"DEPTH,12'WIDTH
348.0,EXIST PUNCHEON
398.0,END AB PLACEMENT
465.5,T/S 2-SNAGS LT
530.0,T/S 12"PINE LT
553.0,EXIST WB,INSTALL DIP
612.0,T/S 12"PINE LT
854.0,T/S 16"SNAG LT
895.5,T/S 12"SNAG RT
923.0,EXIST WB,INSTALL DIP
978.5,T/S 14"PINE RT
1033.0,T/S 14"SNAG LT
The first field is the chainage value followed by the descriptions for that chainage, separated by comma(s). More than one description can be specified here separated by commas.
The operating parameters of this command can be saved into ASCII INI files and restored.
Toolbar : Civil Tools 
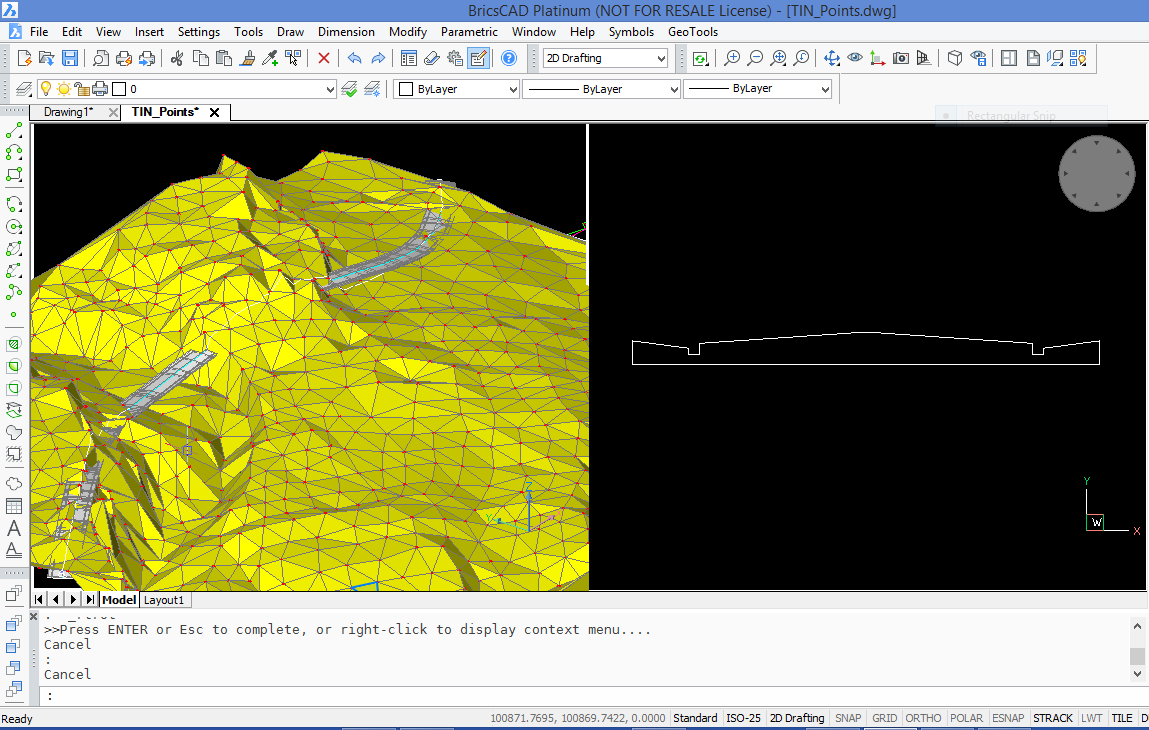
Menu : GeoTools -> Civil Tools -> Draw cross-sectional profile from 3D polyline CmdLine : GT_PROFILE
The GT_PROFILE command is used to create cross-sectional (longitudinal) profiles from 3d polylines. The elevation values (heights) are displayed along the Y axis while the chainages (distances) are displayed along the X axis. In addition, there are options to create named sections, segmental distance annotation, X and Y coordinates annotation as well.
The What to annotate section determines the points along the 3d polyline where the profile annotation is done. You can create annotations in several ways - either at each vertex of the polyline (Source) or at a fixed regular distance (Interpolate) along polyline, or both Source and Interpolate.
Vertical Exaggeration Factor: This is the ratio of the vertical to horizontal scale of the profile. This value shows how many times the vertical measurements (heights) are exaggerated relative to the horizontal measurements (chainages). The horizontal measurements are always created at unit scale (1.0).
Profile Interval: Denotes the interval distance at which the 3d polyline is profiled (this affects the smoothness of the profile curve).
Annotation Interval: Denotes the interval (distance) at which the profile annotation is created.
Reference Height: This is the elevation at the base of the profile. Specifying a non-zero value will prevent the profile vertical lines from being too long.
Starting Chainage Count: When the Create Named Section option is selected, the Starting Chainage Count defines the count of the first point being annotated.
Adjust Annotation Spacing: If the points being profiled are too close to each other, the annotations fall over each other and are cluttered (un-readable). If this option is checked, the annotations will be spaced out (and connected with a guide line) so that the annotation text will not overlap.
Highlight Crossing Objects: This enables special annotations to be placed at positions along the 3d polyline where other objects cross. The crossing objects supported are blocks and shapes. i.e if there is a block or shape object anywhere along the line, that position within the profile will also be annotated.
The Distances from profile bottom option define the distance (drawing units) from the bottom of the profile line to each one of the different horizontal annotations.
Quick stats: Produces statistics about the polyline being profiled. The values obtained from the polyline statistics provide valuable guidance to set the profile parameters more appropriately.
Note: The Chainage output can be saved as Comma Separated Value (CSV) file, which becomes easy to open in Excel and do the required editing
Watch: ![]()
Toolbar : Civil Tools 
Menu : GeoTools -> Civil Tools -> Adjust cross-section elevations CmdLine : GT_ADJUSTLEVELS
The GT_ADJUSTLEVELS command is a “fixer” command to re-compute cross-sectional profile elevations. Often, surveyors may need to re-compute or modify the profile elevations from a new set of elevation data or new profile obtained from other sources. Rather than having to re-create the profile from a new 3d polyline, this command helps by regenerating the levels (elevations) by picking the modified (or new super-imposed) cross-sectional profile line. In other words, while the GT_PROFILE command creates a cross-sectional profile (and elevation / chainage annotations) from a 3d polyline, the GT_ADJUSTLEVELS command would take an ‘already-created’ profile as input and re-create the elevations and chainages.
A few basic parameters that this command would require are datum (reference) height, datum point location, horizontal / vertical exaggeration factors and annotation interval, all of which are asked on the command-line.
Toolbar : Civil Tools 
Menu : GeoTools -> Civil Tools -> Draw graded polylines CmdLine : GT_DRAWGRADE
The GT_DRAWGRADE command creates graded 3D polylines or lines. The grade (or slope) can be specified in several ways, as a percentage (%), decimal (1:n) or as degrees. The grade can be created as a 3d line/polyline or even as descriptive leader objects (with arrows-heads).
Note: Use DIMSCALE variable to control leader arrow size.
Toolbar : Civil Tools ![]()
Menu : GeoTools -> Civil Tools -> Draw stepped 3d polylines CmdLine : GT_STEPPED3DPOLY
Description Pending
Toolbar : Civil Tools 
Menu : GeoTools -> Civil Tools -> Perform traverse error adjustment CmdLine : GT_TRAVADJ
The GT_TRAVADJ command implements the Bowditch's method of traverse adjustment for both open and closed traverse polylines. The Bowditch's method is based on distributing the linear mis-closure (closing error) across each vertex proportionally as a ratio between the distance from the start to the total traverse distance.
Toolbar : Civil Tools 
Menu : GeoTools -> Civil Tools -> Multiple Cross Section Tools CmdLine : GT_CROSSSECT
The GT_CROSSSECT command is a multi-process command that uses several existing GeoTools commands like GT_DRAPEPOLY, GT_SET_Z_PL and GT_PROFILE to perform a series of operations indented to facilitate volume computations across a surface.
The idea behind the GT_CROSSSECT command is to create cross-sectional profiles across the terrain at regular intervals (strips) and to compute the cross-sectional area formed by each strip. This area multiplied by the width of the strip gives the volume of each strip of the terrain. The sum of the volumes of each strip gives the volume of the entire surface.
Watch: ![]()
Toolbar : Civil Tools 
Menu : GeoTools -> Civil Tools -> Alignment C/F CmdLine : GT_ALIGNMENTCF
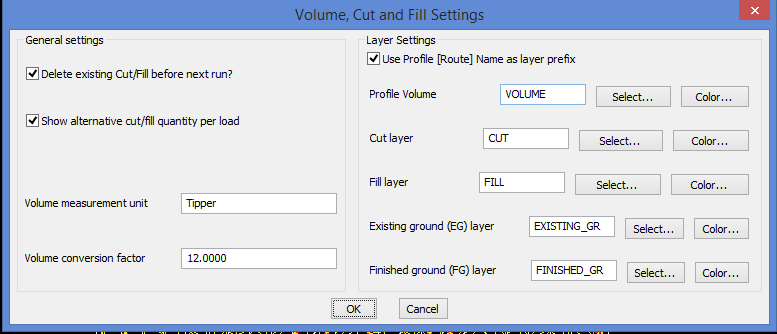
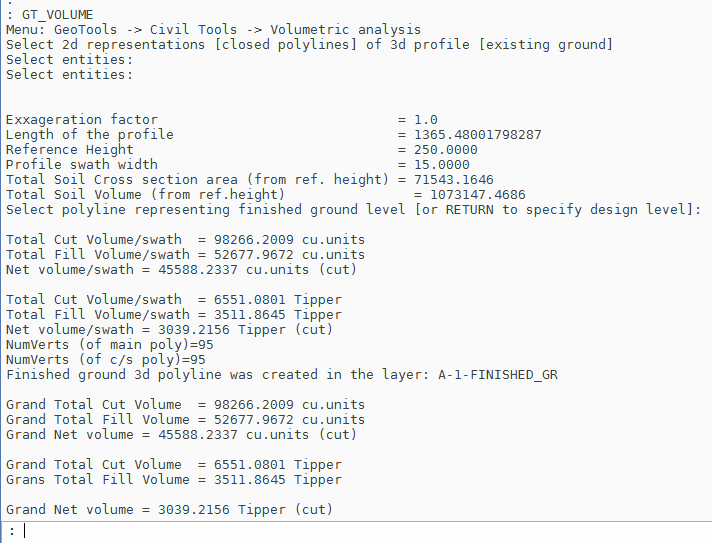
The GT_ALIGNMENTCF command is used to analyze two cross-sectional profiles created by GT_CROSSSECT command and compute the cut-fill areas across the profile. The inputs for this command are the closed cross-sectional profile line created by GT_CROSSSECT command and a new finished grade alignment line across the profile that you want to place. Given these two inputs, the GT_VOLUME command will compute the cut and fill areas and color them accordingly as specified in the settings (see dialog box above) and display the same on the profile.
The volume computation can be reported in terms of number of cubic units or as a measure of the number of excavating vehicles. For example, if I have a tipper capable of carrying 12 cu.m of soil, I will enter the 'Volume measurement unit' as 'Tipper' and the 'Volume Conversion factor' as 12.0.
The GT_ALIGNMENTCF command can also create an updated 3d polyline that represents the finished ground level.Since the existing ground profile is linked to the 3d polyline from which it was created, GT_ALIGNMENTCF command creates an updated 3d polyline of finished ground polyline as well. The layers for existing ground and finished ground are specified in the dialog box as shown above.
At the end of the computation, there is also a listing of the total area of fill and cut.
Toolbar : Civil Tools 
Menu : GeoTools -> Civil Tools -> Create map grid CmdLine : GT_ANNOGRID
The GT_ANNOGRID command is used to draw a map grid within a map sheet. The map sheet can be specified either by picking an existing sheet index block (created by the GT_SHEETINS command) or by picking points on the screen to 'show' the extents of the map sheet. Two types of annotation parameters are required – the X/Y spacing for the grid tick marks and the X/Y spacing for the grid annotation text at the edges. The grid tick marks as well as the annotation text are defined in pre-defined blocks which can be customized to achieve a custom grid. A sample format of these pre-defined blocks is provided in the BLOCKS folder under the GeoTools installation folder. The name of the grid tick mark block is GRID_CROSS.dwg and the names of the grid text blocks (annotations at the edges) are TICK_LEFT.dwg, TICK_RIGHT.dwg, TICK_TOP.dwg and TICK_BOTTOM.dwg. You CAN CHANGE the style/color/linetype etc of these blocks to suit your annotation style and requirements but DO NOT change the insertion point or the attribute tag of the lone attribute in this block.
Scale: The scale value used here is only as a key to specify at which map scale the mapping is done, so that all the grid annotation settings can be saved for future reference with this as the reference. (Note: This scale has no effect on any of the other values specified in the grid annotation settings).
You can thus define multiple sets of annotation settings for different map scales and display them in the list box. Such sets can be saved and restored from ASCII INI files for future use. You can then choose one of them and click on Make Current to make them the current settings. Upon clicking on Ok, the current settings are used by the program to perform grid annotation.
Toolbar : Civil Tools 
Menu : GeoTools -> Civil Tools -> Bearing and Distance CmdLine : GT_BEARINGDIST
The GT_BEARINGDIST command will create the bearing angle and distance annotation (as text objects) from one selected point to another.
Toolbar : Civil Tools 
Menu : GeoTools -> Civil Tools -> Round off bearings CmdLine : GT_BRGROUND
The GT_BRGROUND command is used to round off bearings to a specified precision. Usually the bearings are represented in typical styles like : 50-23-24, 149d49'32", 38° 55' 46", N 149° 41' 27" E, S 85d27' E and so on. The GT_BRGROUND command works on the seconds part of the bearing and rounds it off to the nearest number of specified seconds.
Toolbar : Civil Tools 
Menu : GeoTools -> Civil Tools -> Color-coded slope display of TIN faces CmdLine : GT_SLOPEDISPLAY
The GT_SLOPEDISPLAY command is used to color-code TIN triangles (3dfaces or 3dpolylines) as per a range of slope values. A maximum of 5 slope ranges is allowed. The start and end slope values of the range is specified and a color is chosen for each slope range. The slope representation can be done as a solid HATCH fill or a SOLID object fill.
The GT_SLOPEDISPLAY command allows slope value up to 2000% which is a 87 degree slope. It allows to compute the slope in both degrees and percentage. The output of slope can be exported into .CSV format.
Watch: ![]()
Toolbar : Civil Tools 
Menu : GeoTools -> Civil Tools -> Find slope of a single 3dface or 3dpolyline CmdLine : GT_FINDSLOPE
The GT_FINDSLOPE command is used to query the slope of a single 3dface or 3dpolyline, The slope in percentage is displayed on the command line.
Toolbar : Civil Tools 
Menu : GeoTools -> Civil Tools -> Find slope between two points CmdLine : GT_FINDSLOPELINE
Description Pending
Toolbar : Civil Tools 
Menu : GeoTools -> Civil Tools -> Draw Voronoi polygons CmdLine : GT_VORONOI
The GT_VORONOI command is used to draw Voronoi polygons from a selection of points and blocks. This command uses the settings as set in the GT_TRIANGULATE command and generates the Voronoi polygons.
Toolbar : Civil Tools 
Menu : GeoTools -> Civil Tools -> Road Design -> Create road carriageway CmdLine : GT_CreateCarriageway
The GT_CREATECARRIAGEWAY command is a 3d visualization tool that also helps to build the 3d DTM and model of the road carriageway. You need to first have the finished road alignment created as a 3d polyline (using the GT_VOLUME command). You can then define a closed 2d polyline as the cross-section of the road carriageway and it can be swept through the 3d alignment to create a 3d model of the road carriageway.
Toolbar : Civil Tools ![]()
Menu : GeoTools -> Civil Tools -> Road Design -> Draw Vertical Curves CmdLine : GT_DRAWVCURVES
The GT_DRAWVCURVES command is used to design vertical alignment curves.
Toolbar : Civil Tools ![]()
Menu : GeoTools -> Civil Tools -> Road Design -> Draw horizontal alignment Curves CmdLine : GT_DRAWHCURVES
Description Pending
Toolbar : Civil Tools ![]()
Menu : GeoTools -> Civil Tools -> Civil 3D LandXML to CSV CmdLine : GT_LANDXML2CSV
Description Pending